
Loading data library...
New: How to use the Data Explorer
Search, compare, transform, and export economic series. Close this guide with the X and reopen it at any time from the red help link below Browse Categories.
- Find data. Search by title, units, or frequency, or browse the category hierarchy.
- Edit lines. Add datasets, choose axes and chart styles, transform units, or change frequency and aggregation.
- Set the range. Use a preset period or choose custom start and end dates before comparing or exporting.
- Export results. Download the visible transformed observations as CSV or save the current plot as a high-resolution image.
- Compare timing. Add two datasets, open Dot plot and regression, then shift X or Y by signed observation periods. Negative values shift earlier; positive values shift later.
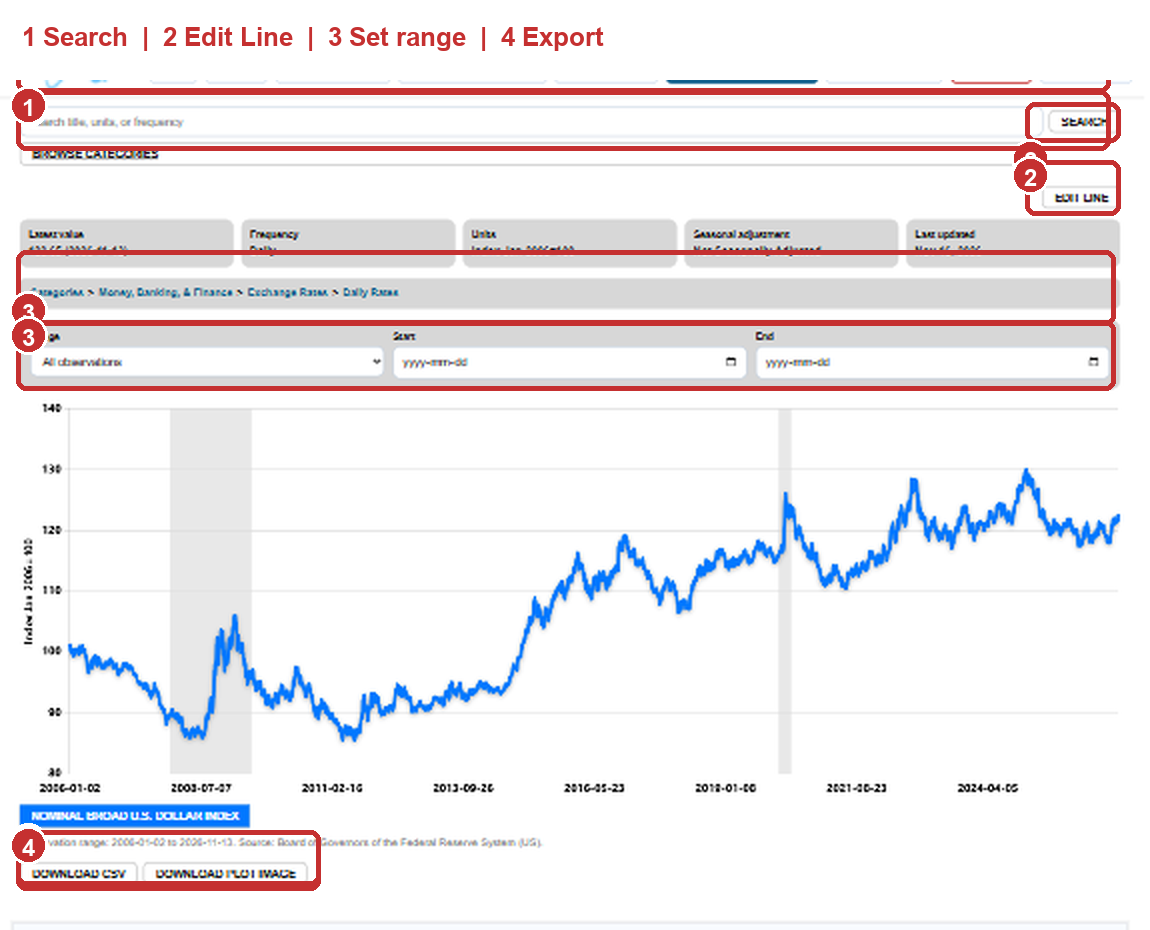 Open the overview graphic at full size
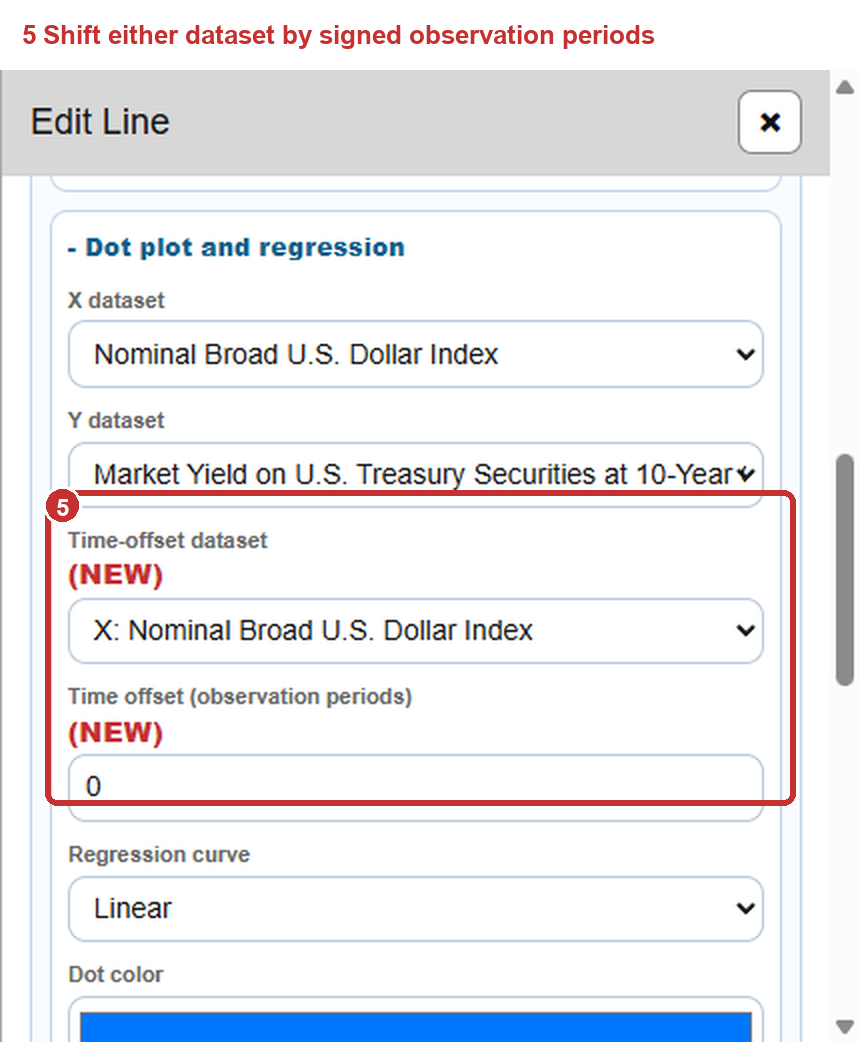 Open the time-offset graphic at full size