GDP Dynamics Q4 Nowcast Holds at 0.9% as Underlying Growth Estimate Edges Lower
Date: 2026-11-13Author: GDP Dynamics
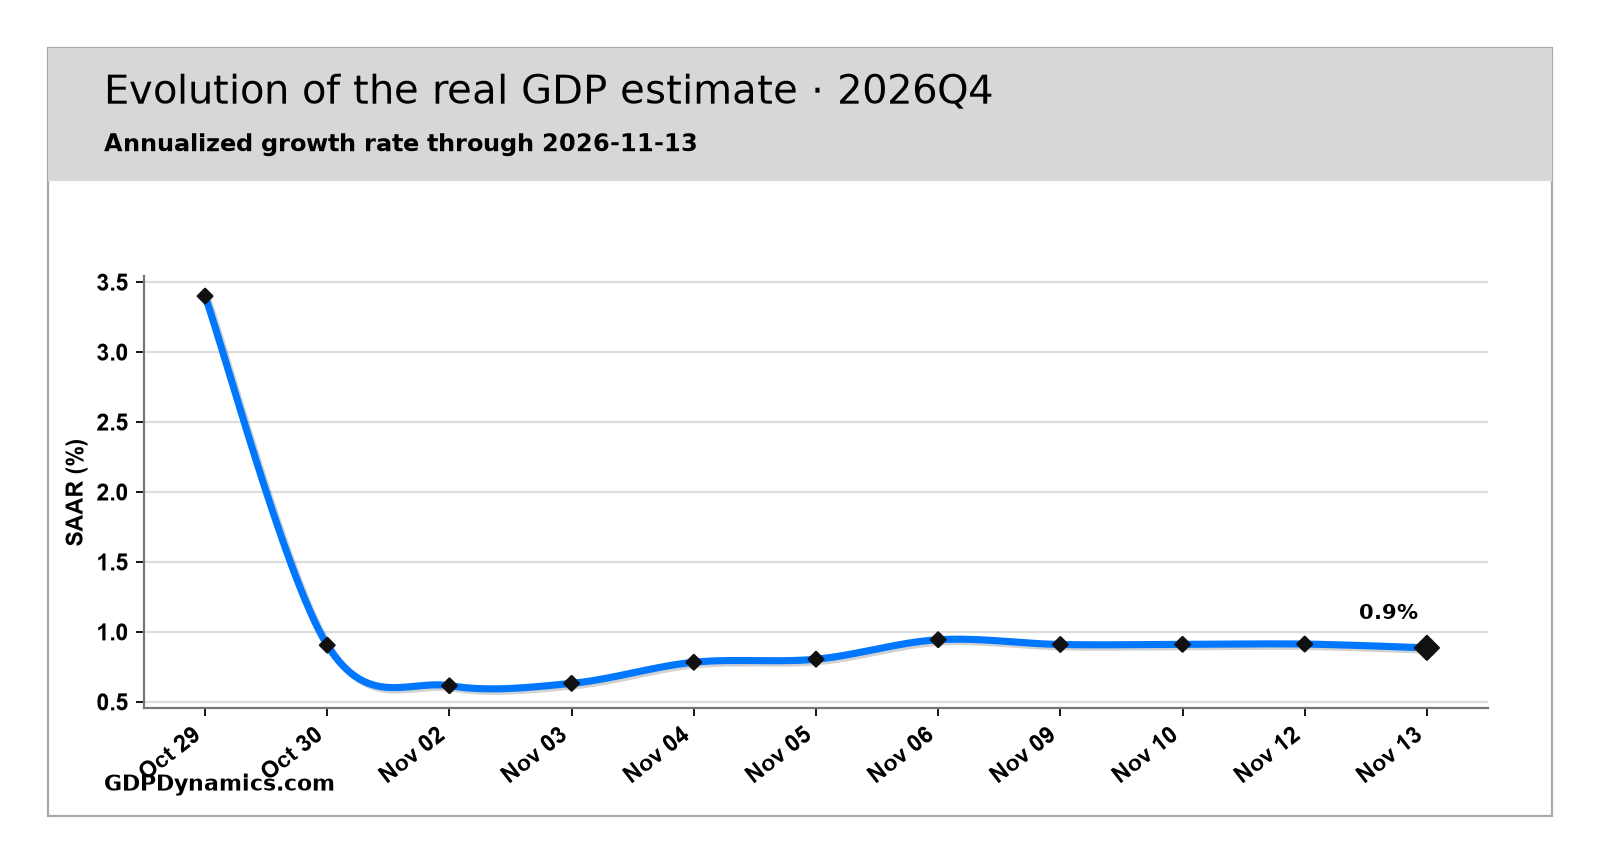
The GDP Dynamics nowcast for fourth-quarter 2026 U.S. real GDP growth remains at 0.9% on a seasonally adjusted annualized basis (SAAR), unchanged from Thursday's published estimate. Beneath the rounded figure, however, the forecast has weakened slightly.
The underlying estimate declined from 0.913% to 0.886%, a reduction of 0.027 percentage points. Both figures round to 0.9%, but the movement is visible in the daily nowcast path. On a non-annualized basis, the current forecast corresponds to approximately 0.2% growth for the quarter.
The adjustment is small, but it comes against a backdrop of elevated borrowing costs, persistent producer-price inflation, and an economy showing uneven contributions from its major expenditure components.
Nowcast Path
Housing and Business Investment Offer Limited Support
Residential investment registered a small improvement in the latest model update, although its overall contribution to fourth-quarter growth remains negative at approximately 0.2 percentage points.
That distinction matters. A sector can improve relative to the previous forecast without making a positive contribution to GDP growth overall.
Housing continues to face difficult financing conditions. The latest available Census Bureau figures show that housing starts fell 5.2% in September to a seasonally adjusted annual rate of 1.221 million units. The next housing-starts report is scheduled for November 18, leaving the model dependent on existing construction indicators and other available information.
Business fixed investment also registered a modest positive adjustment. Its estimated contribution now stands at approximately 0.4 percentage points, providing some support to the quarterly growth forecast.
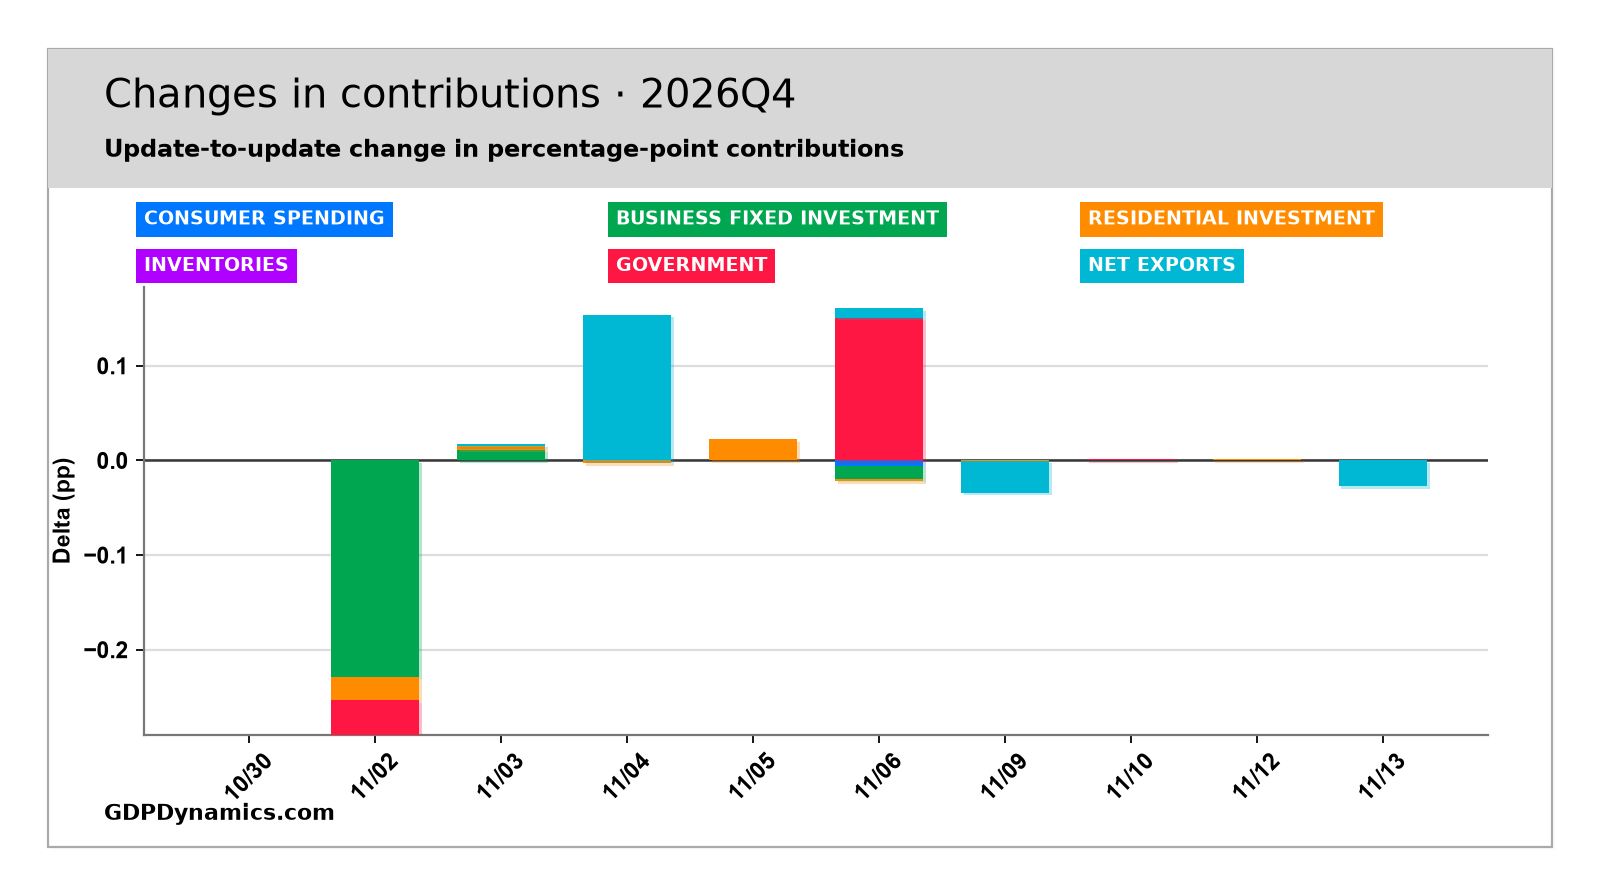
Both upward revisions are too small to register at the one-decimal precision used in the contribution-change summary. Consequently, they should be treated as marginal adjustments rather than evidence of a substantial acceleration in either sector.
Net Exports Weigh on the Forecast
Net exports moved in the opposite direction, recording a small deterioration in the latest update. The external sector remains the largest negative contribution in the current expenditure breakdown, subtracting approximately 0.8 percentage points from estimated GDP growth.
This is a meaningful weakness in the composition of the forecast, even though the latest downward revision is small.
Net exports measure the difference between exports and imports. A weaker contribution can result from softer export volumes, stronger imports, or some combination of the two. The current snapshot does not identify which of those channels accounts for the latest adjustment.
For that reason, the change should not be interpreted as evidence of a new trade shock. It indicates that the model's estimated external-sector contribution has weakened slightly relative to Thursday's forecast.
Labor Markets, Producer Prices and Borrowing Costs
The latest economic releases provide additional context for the modest adjustment.
Initial unemployment insurance claims increased by 9,000 to 200,000 in the week ending November 7, according to the Department of Labor. The four-week moving average remained unchanged at 195,250.
The increase suggests some softening relative to the previous week, although claims remain historically low. The data do not currently indicate a sharp increase in layoffs.
Friday's Producer Price Index report offered a more complicated inflation picture. Final-demand producer prices increased 0.3% in October, down from September's 1.4% increase and slightly below market expectations. Over twelve months, however, producer prices rose 6.5%, indicating that underlying price pressures remain substantial.
Higher financing costs present another challenge. The 10-year U.S. Treasury yield was trading around 5.1% on Friday, reflecting a bond market still concerned about inflation and the direction of monetary policy. Elevated long-term yields increase financing costs for housing construction and business investment, potentially limiting future capital spending.
Oil markets have also remained volatile. Brent and West Texas Intermediate crude were heading toward a second consecutive weekly decline as concerns about supply conditions and demand shifted market expectations. Changes in energy prices can affect production costs, household purchasing power, and the nominal value of trade flows, although their ultimate effect on real GDP depends on the response of volumes and prices.
These releases help describe the economic conditions surrounding the forecast. They do not, by themselves, establish the precise numerical cause of the latest revisions to the model's expenditure components.
Where Fourth-Quarter Growth Currently Stands
Consumer spending remains the largest positive contribution to the estimated growth rate, adding approximately 1.1 percentage points. This reflects the structural importance of household consumption in the U.S. economy, not necessarily an improvement in spending momentum in the latest update.
Business fixed investment adds approximately 0.4 percentage points, while inventories contribute another 0.2 percentage points. Government spending adds roughly 0.1 percentage points.
Those positive contributions are partly offset by the external sector, at negative 0.8 percentage points, and residential investment, at negative 0.2 percentage points.
The current breakdown shows an economy that continues to expand, but not particularly quickly. Household demand and nonresidential investment provide support, while housing and international trade subtract from the quarterly estimate.
<figure><img src="assets/2026-11-13_gdp-dynamics-q4-nowcast-holds-at-0-9-as-underlying-growth-estimate-edges-lower/nowcast_daily_contributions.png" alt="Contribution Levels" loading="lazy" /><figcaption>Contribution Levels</figcaption></figure>
What Changed Since Thursday?
The latest update is better understood as a minor redistribution of estimated contributions than as a change in the overall growth outlook.
Residential investment and business fixed investment improved marginally, while net exports weakened. These changes are smaller than the precision shown in the component-change summary, with each appearing as approximately 0.0 percentage points when rounded to one decimal place.
The combined result, alongside the remaining model adjustments, was a reduction of 0.027 percentage points in the underlying GDP growth estimate.
That is why the nowcast path moves lower even though the published headline remains unchanged at 0.9%.
Contribution Changes
Outlook: Slow Growth With Limited Room for Further Weakness
At 0.9% annualized, the GDP Dynamics forecast points to a fourth quarter characterized by slow expansion rather than outright contraction.
The immediate question is whether the negative contributions from housing and net exports begin to narrow, or whether they continue to offset gains elsewhere in the economy.
Upcoming releases on residential construction, manufacturing activity, trade and consumer spending will help determine whether the current estimate stabilizes or moves further in either direction.
For now, Friday's update leaves the headline unchanged, but the small downward movement underneath it is worth watching. If the same pattern continues, what currently appears to be a negligible daily adjustment could develop into a more meaningful revision to fourth-quarter growth expectations.