GDP Dynamics Q3 Nowcast Slips to 2.42% as Inventories and Trade Weigh on Growth
Date: 2026-09-16Author: GDP Dynamics
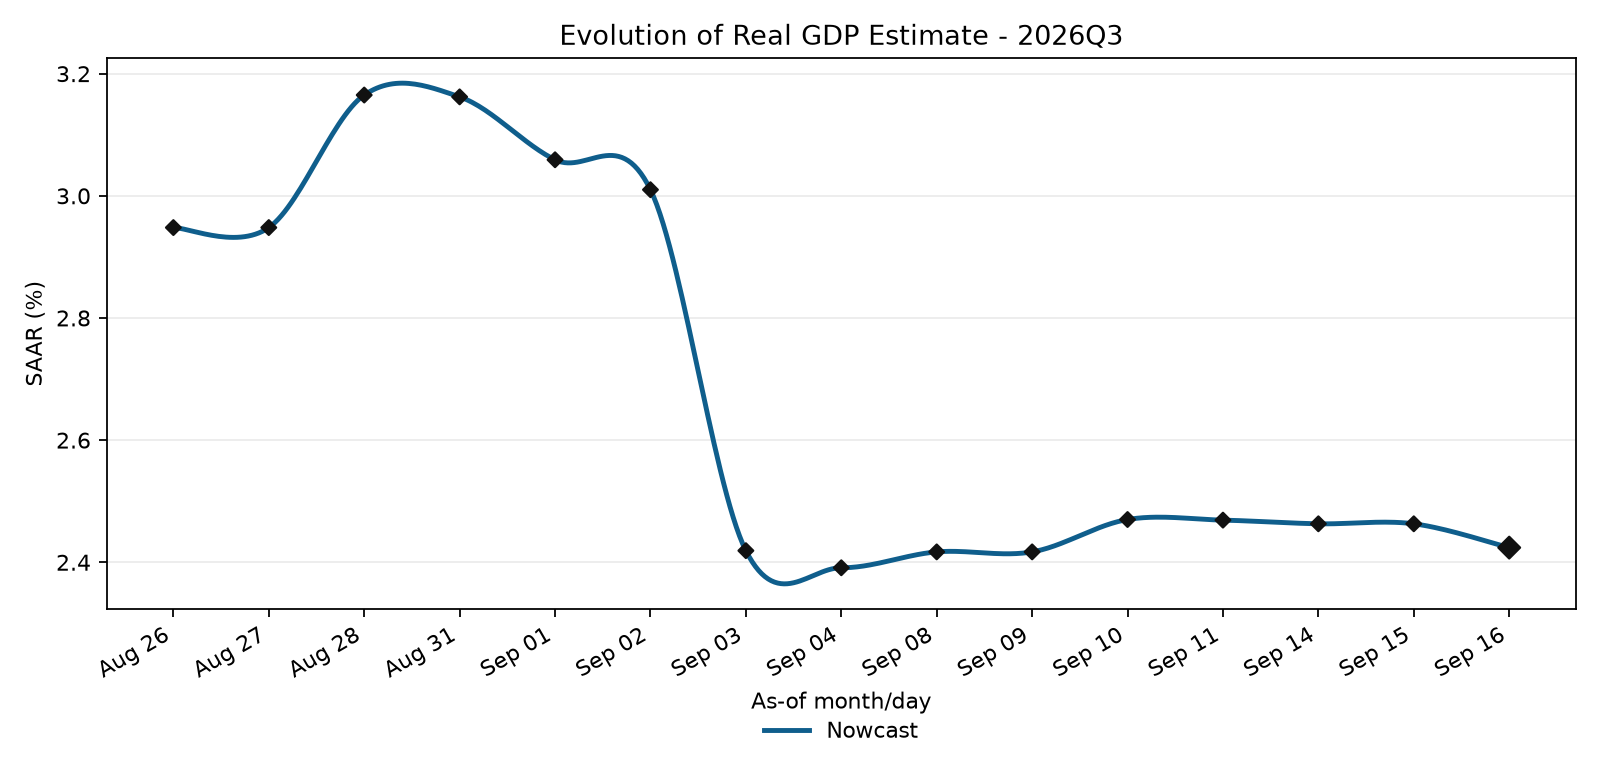
The GDP Dynamics nowcast for third-quarter U.S. real GDP growth slipped to 2.42% SAAR on September 16, down 0.04 percentage point from yesterday's estimate. On a quarter-over-quarter basis, the model is currently tracking growth of about 0.61%.
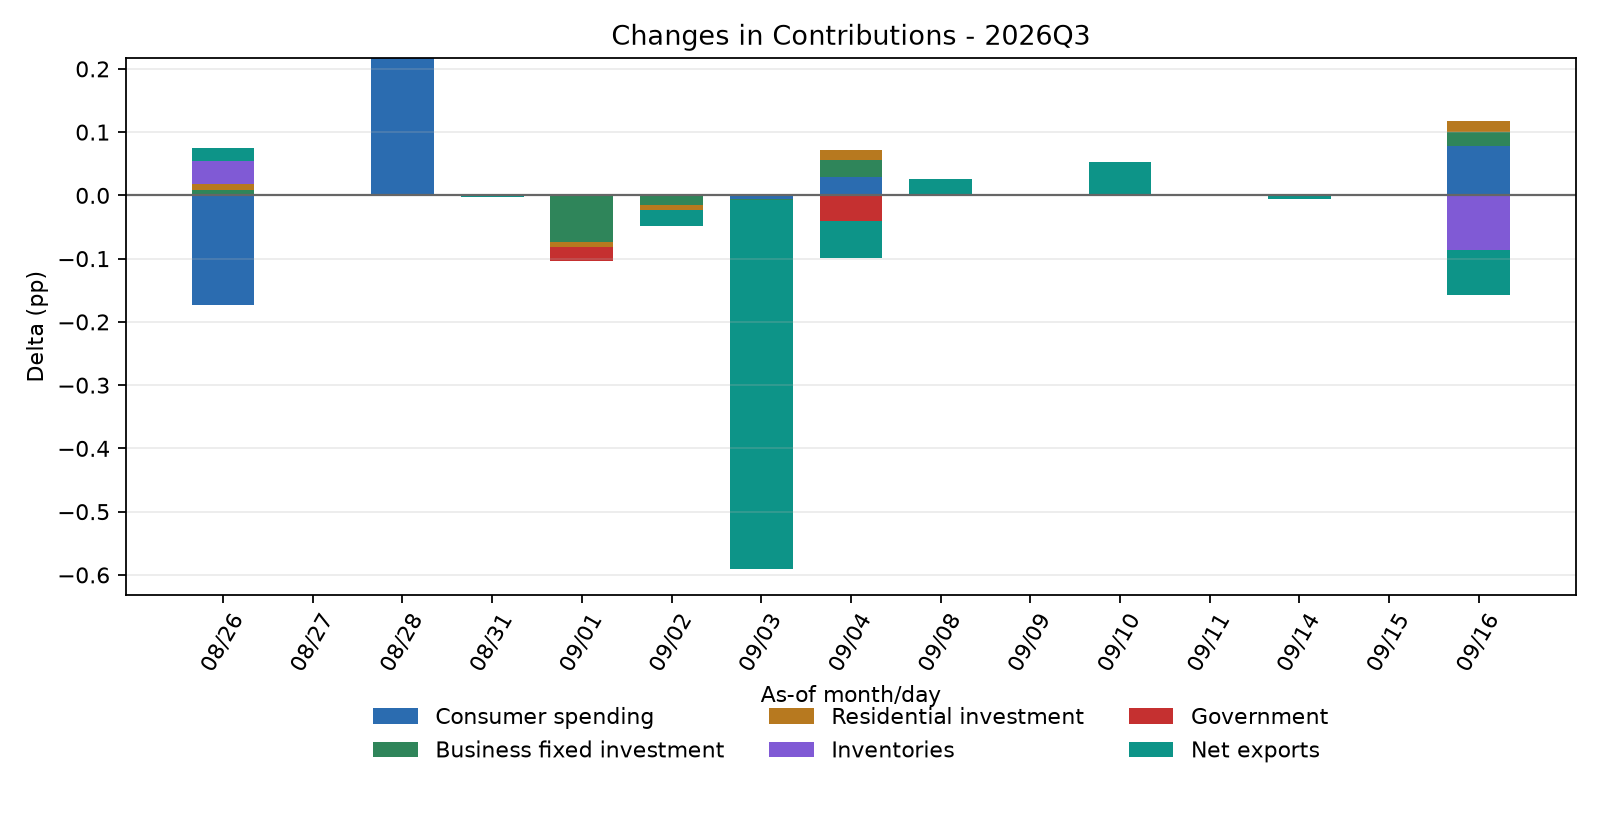
The move was small, but there was considerably more movement underneath the headline number. Consumer spending, business fixed investment, and residential investment all improved, while inventories and net exports moved in the opposite direction. The negative revisions were just large enough to outweigh the gains.
Consumer Spending Improves
Consumer spending added 0.08 percentage point to the nowcast compared with the previous update, the largest positive change among the major GDP components today.
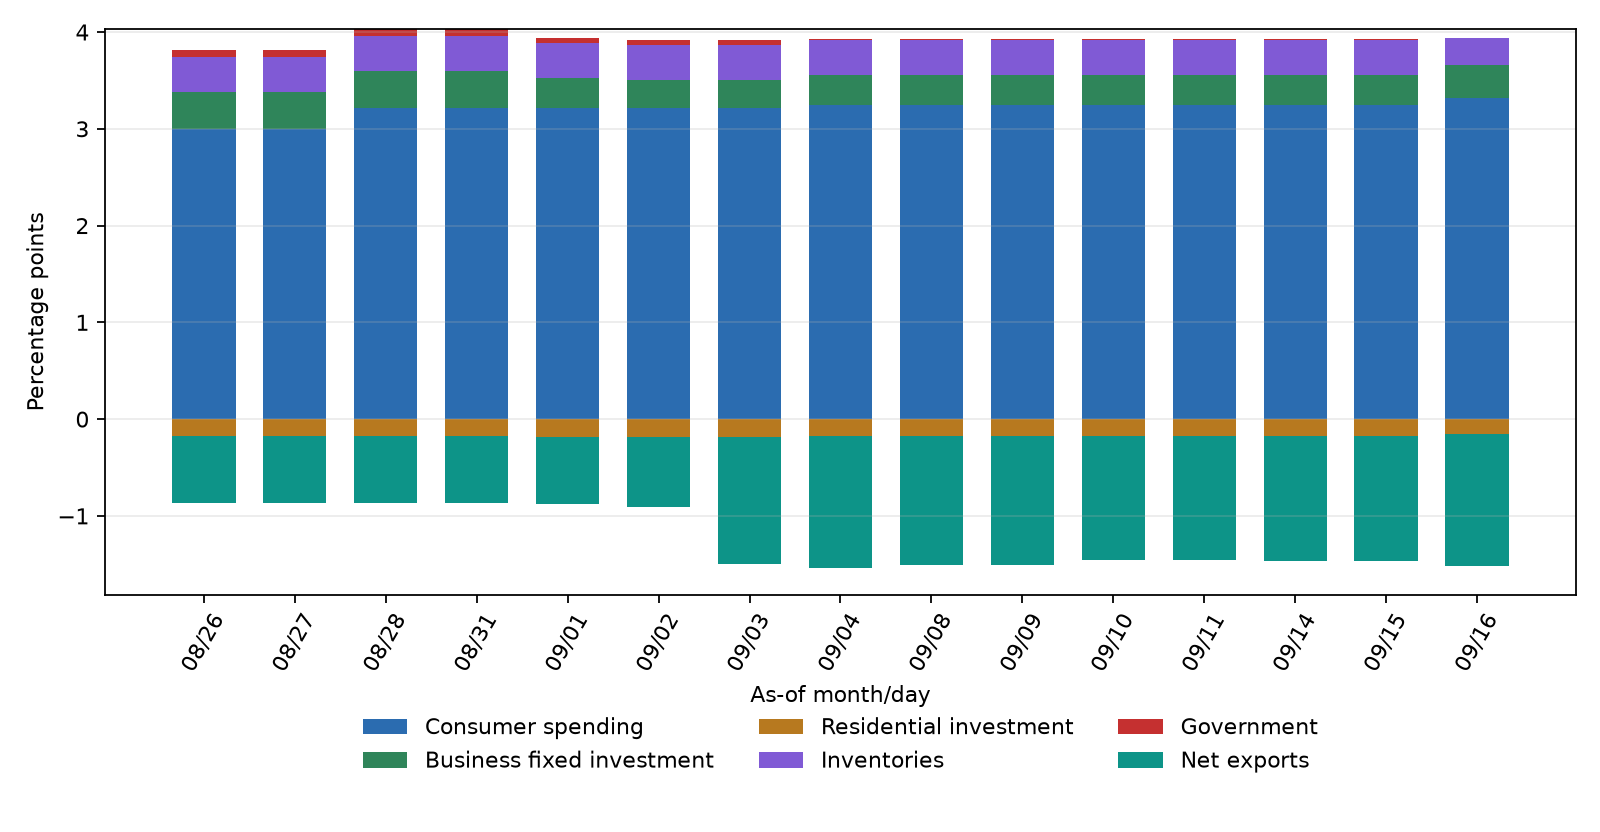
That improvement matters more than the already-high level of the consumption contribution. Consumer spending currently contributes 3.32 percentage points to the model's Q3 growth estimate, but consumption is structurally the largest part of GDP. The more useful signal today is that its estimated contribution actually increased.
The September 16 update incorporated new information from the retail side of the economy. The Census Bureau's August retail-sales release provides a new read on household spending during the third quarter, replacing some of the model's previously estimated information. Retail sales are nominal and cover only part of total personal consumption expenditures, so I do not treat them as equivalent to real consumer spending. They nevertheless provide an important high-frequency signal for the consumption bridge equations.
The result in today's model is fairly straightforward: the incoming spending data pushed the consumer side of the Q3 estimate higher rather than lower.
Contribution Changes
Inventories Take Back Part of the Gain
Inventories were the largest drag on today's revision, subtracting 0.09 percentage point from the Q3 nowcast compared with yesterday.
The September 16 Census report gives some context for that movement. Total manufacturers' and trade inventories increased 0.8% in July to $2.765 trillion, while combined business sales and manufacturers' shipments increased only 0.3%. The overall inventory-to-sales ratio stood at 1.30, down from 1.37 a year earlier.
That does not mean inventories are currently subtracting from GDP in the model. They are still contributing approximately +0.28 percentage point to Q3 growth. What changed is the estimated size and timing of the stock build. Today's data caused the model to mark that contribution down by 0.09 percentage point.
This distinction is important with inventories because GDP depends on the change in inventories, not simply whether businesses have a large amount of goods sitting on shelves. A positive inventory contribution can therefore weaken substantially without turning negative.
The wholesale data released September 10 also showed inventories rising 1.3% in July while wholesale sales rose 0.8%. The wholesale inventory-to-sales ratio was 1.20, compared with 1.28 a year earlier. Taken together with today's broader business-inventory report, the data point toward continued stock accumulation, but the model now sees a smaller Q3 growth contribution from that process.
Trade Remains a Major Headwind
Net exports were the second-largest negative revision, reducing the nowcast by another 0.07 percentage point.
This fits with the July international trade data released earlier this month. The U.S. goods and services trade deficit widened sharply from $71.2 billion in June to $88.6 billion in July. Exports fell $6.6 billion to $310.7 billion, while imports increased $10.8 billion to $399.3 billion.
That combination is unfavorable for the net-export contribution to GDP. Imports enter the GDP expenditure identity as a subtraction because they are already embedded in consumption, investment, and government spending but were not produced domestically. At the same time, weaker exports mean less foreign demand for U.S. production.
The effect is now substantial in the model. Net exports currently subtract about 1.36 percentage points from Q3 growth, and today's update pushed that contribution another 0.07 percentage point lower.
One particularly notable feature of the July trade report was capital-goods imports, which reached a record $140.3 billion. That is a good example of why the import subtraction should not automatically be interpreted as economic weakness. Some of those imports can support domestic investment even while mechanically lowering the net-export contribution to GDP.
Contribution Levels
Investment Provides a Small Offset
Business fixed investment added another 0.02 percentage point in today's update, bringing its current contribution to approximately +0.34 percentage point.
The move is modest, but it remains consistent with an economy where capital spending has not collapsed. Even the Federal Reserve's September 16 policy statement characterized capital investment as robust while describing overall economic activity as expanding at a solid pace.
Residential investment also improved by 0.02 percentage point. It remains a drag on the quarter, currently subtracting approximately 0.15 percentage point, but the size of that drag has diminished slightly.
The next important housing information arrives September 17 with the Census Bureau's August housing starts and building permits report. That should provide a better indication of whether today's modest improvement in residential investment is sustained as more Q3 data enter the model.
Government spending is essentially neutral in the current estimate, contributing roughly +0.01 percentage point.
A Lot of Movement, but Little Change in the Headline
Today's update is a good example of why I prefer looking underneath the headline GDP number.
The nowcast only fell 0.04 percentage point, from yesterday's estimate to 2.42%, but the components moved considerably more than that. Inventories knocked off 0.09 point and net exports another 0.07 point. Consumer spending added 0.08 point, while business and residential investment each added another 0.02 point.
Those movements largely canceled each other out.
The composition of growth is therefore changing more than the headline nowcast suggests. Domestic private demand looks somewhat firmer in today's update, particularly on the consumer side, while inventories and the external sector are pulling the estimate in the opposite direction.
That is exactly why I built GDP Dynamics around the individual expenditure components rather than treating GDP as a single variable to forecast. A stable headline number can hide meaningful changes in what is actually happening underneath it.
Nowcast Path
Q3 GDP Nowcast: 2.42%
For now, GDP Dynamics is estimating 2.42% annualized real GDP growth in Q3 2026, equivalent to approximately 0.61% quarter-over-quarter growth.
Today's data did not dramatically change that outlook. Instead, they changed its composition. Consumer spending and fixed investment provided some support, while inventories and a widening trade deficit pulled in the other direction.
There is still plenty of Q3 data to come, so I expect the internal composition of the estimate to continue moving as the quarter fills in.