GDP Dynamics Nowcast Rises to 2.47% as Net Exports Improve
Date: 2026-09-10Author: GDP Dynamics
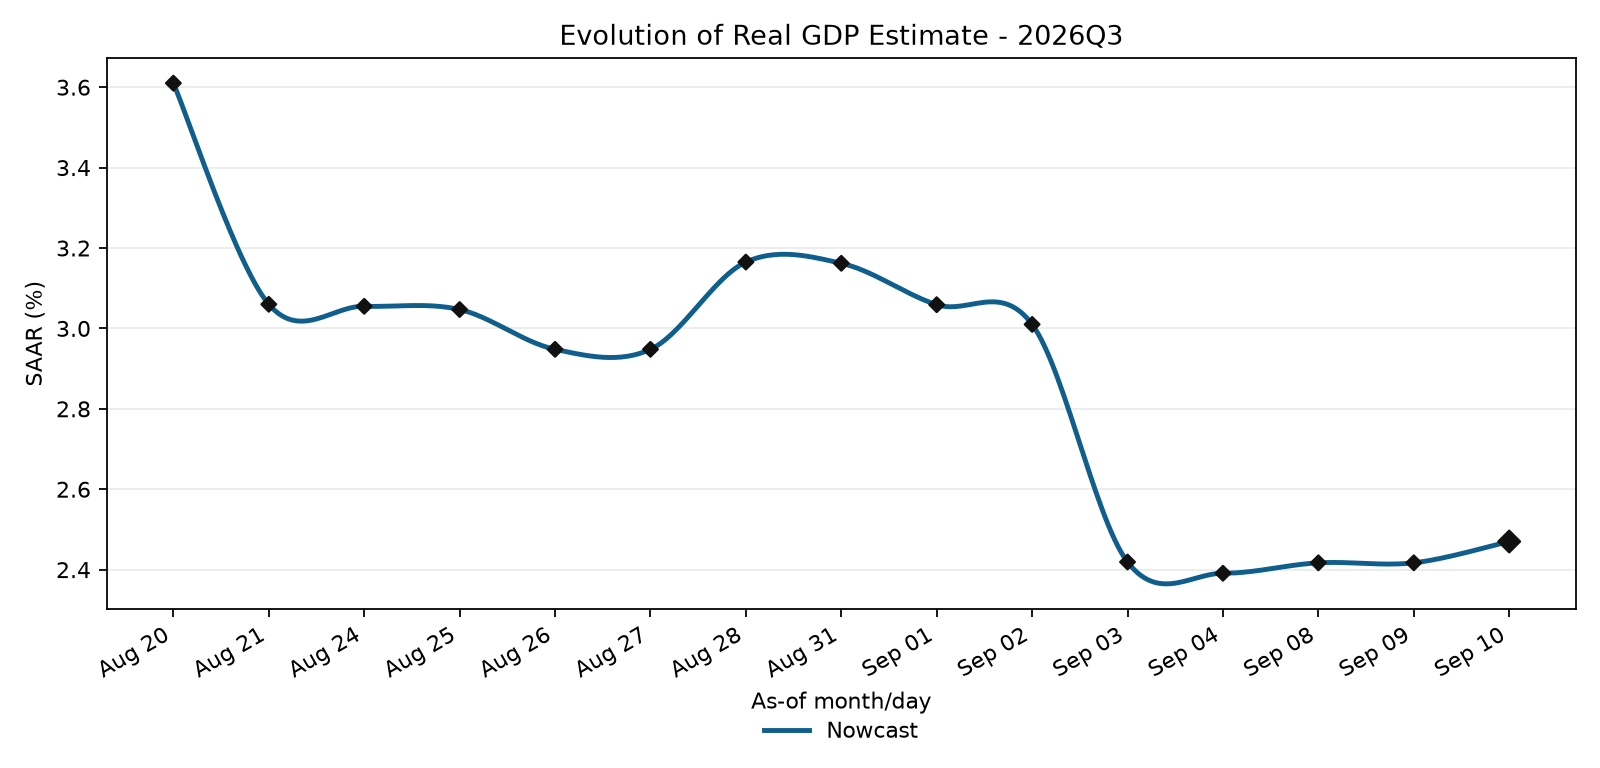
The GDP Dynamics nowcast for the third quarter of 2026 rose slightly on September 10, increasing from 2.42% to 2.47% annualized. That works out to roughly 0.62% growth quarter over quarter.
It is a small revision, but it continues to leave the model pointing toward a fairly solid quarter for the U.S. economy. More importantly, the source of today's increase was relatively concentrated. The improvement came almost entirely from the model's estimate of net exports rather than a broad upward revision across domestic demand.
Nowcast Path
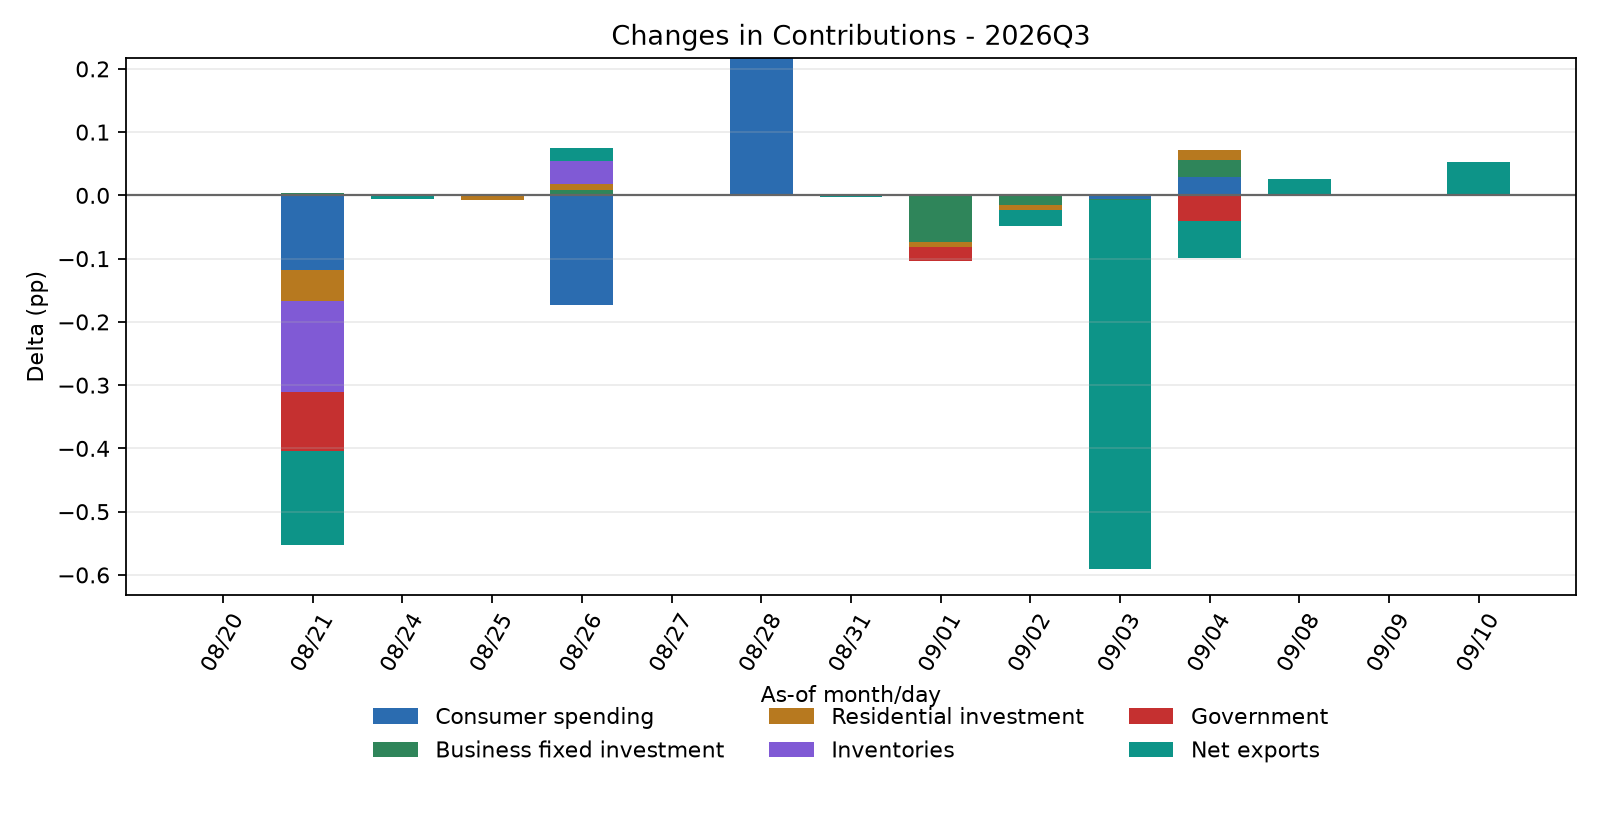
Net Exports Add 0.05 Percentage Point
Net exports improved the Q3 nowcast by approximately 0.05 percentage point, enough to account for essentially the entire increase in the headline estimate.
That needs a little explanation because it would be misleading to interpret today's move as evidence that the latest official trade report suddenly became stronger.
The most recent BEA international trade report, covering July, actually showed the opposite. The U.S. goods and services deficit widened from $71.2 billion in June to $88.6 billion in July. Exports declined 2.1% while imports increased 2.8%. In other words, the most recent hard trade data were a drag rather than an obvious source of strength.
Today's movement is therefore better understood as a change in the model's estimate of the external-sector contribution as the information set evolves, rather than as a declaration that the underlying trade balance has suddenly improved.
That distinction matters with a nowcast. A component can move between daily estimates even when there has not been a new official release for that component. The model is continuously incorporating the information available to it and translating changes in its predictors into estimates of quarterly GDP components.
The Composition of the Q3 Nowcast
The current estimate also tells an interesting story about where the model thinks Q3 growth is coming from.
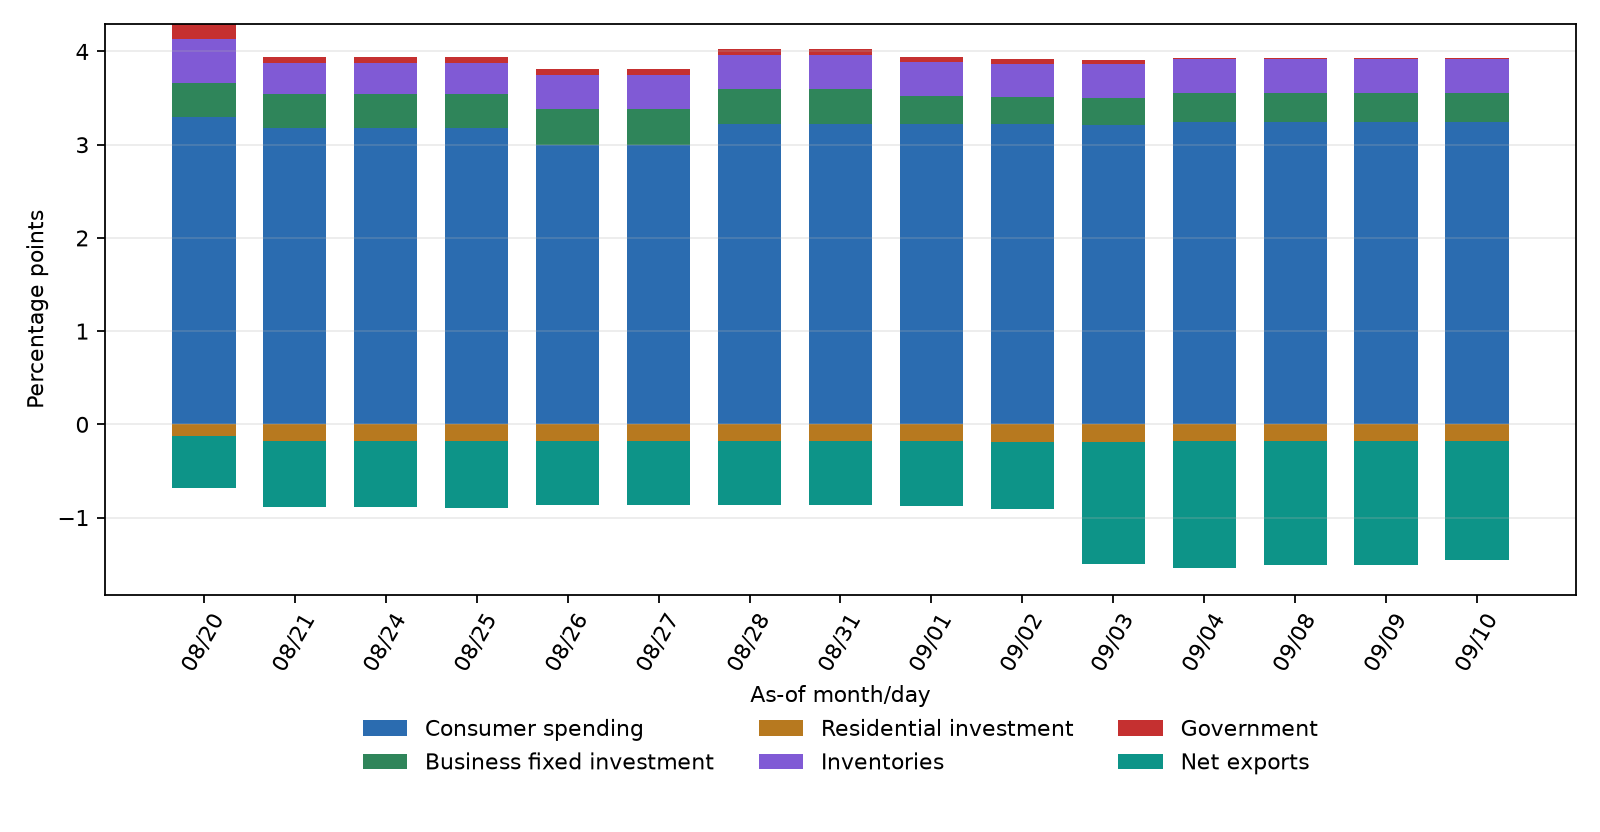
Consumer spending currently contributes approximately 3.24 percentage points to annualized GDP growth. That remains a very large contribution, although its size by itself should not be interpreted as evidence that consumption was responsible for today's increase. Consumption is structurally the largest part of GDP and consequently tends to carry the largest contribution level.
Net exports currently subtract approximately 1.28 percentage points, despite today's 0.05-point improvement. Inventories add around 0.36 percentage point, while business fixed investment contributes approximately 0.32 point.
Residential investment remains a modest drag at approximately -0.17 percentage point, while government spending is currently close to neutral at roughly +0.01 point.
Contribution Levels
That composition is important. A 2.47% headline number can look relatively uncomplicated, but underneath it the model is showing considerable offsetting movement. Strong estimated consumption growth is being partially offset by a substantial negative contribution from the external sector, while inventories and business investment provide additional support.
Today's Data Still Show a Resilient Labor Market
The September 10 information set included several financial and economic indicators, including initial jobless claims, Treasury yields, mortgage rates, oil prices and financial conditions.
Initial unemployment claims provided another indication that outright layoffs remain relatively subdued. Claims came in at around 206,000, reinforcing the picture of a labor market that may be cooling without yet showing the kind of widespread layoffs normally associated with a sharp contraction.
That distinction remains important for the Q3 outlook. Slower hiring and weaker employment growth can weigh on household income and consumption without necessarily producing an immediate recessionary collapse. As long as layoffs remain relatively contained, the labor market can continue providing some support to household spending even as other indicators soften.
At the same time, financial conditions deserve watching. Higher Treasury yields feed into borrowing costs throughout the economy, while mortgage rates near 7% continue to create a difficult environment for housing.
That helps explain why I remain cautious about residential investment even though today's revision to that component was effectively zero when rounded to two decimal places. The model currently has residential investment subtracting about 0.17 percentage point from Q3 growth.
Oil and Interest Rates Are Becoming More Important
Energy prices are another variable worth watching closely.
The September 10 snapshot includes both Brent and WTI crude prices, and the recent increase in oil adds another potential headwind. Higher energy costs can work through household purchasing power, transportation costs, business margins and eventually inflation.
At the same time, higher longer-term Treasury yields matter well beyond the bond market. Mortgage rates, corporate borrowing costs and other financing rates are linked more closely to longer-duration market rates than directly to the Federal Reserve's overnight policy rate.
Neither development necessarily changes the Q3 picture immediately. But together they create a less favorable financial backdrop than the headline 2.47% GDP estimate alone might suggest.
A Small Upgrade, Not a Change in the Story
The best way to characterize the September 10 update is therefore as a small upward revision rather than a major change in the Q3 outlook.
GDP Dynamics moved up 0.05 percentage point, from 2.42% to 2.47%, with net exports accounting for essentially the entire revision. Residential investment and business fixed investment were effectively unchanged at the precision shown in the daily contribution changes.
Contribution Changes
The broader composition remains much more interesting than the five-basis-point headline move. Consumer spending continues to provide substantial support, inventories and business investment are positive, housing remains a drag, and the external sector continues to subtract considerably from estimated Q3 growth despite today's modest improvement.
For now, 2.47% annualized growth remains a picture of an economy expanding at a respectable pace rather than sliding toward outright contraction. But the combination of a large negative trade contribution, weak housing, rising longer-term borrowing costs and higher energy prices gives us plenty to watch as more hard Q3 data arrive.
The next important question is whether incoming releases confirm the domestic strength currently embedded in the model or begin pulling that 2.47% estimate lower.