GDP Dynamics Q3 Nowcast Rises to 2.42% as Net Export Drag Eases
Date: 2026-09-08Author: GDP Dynamics
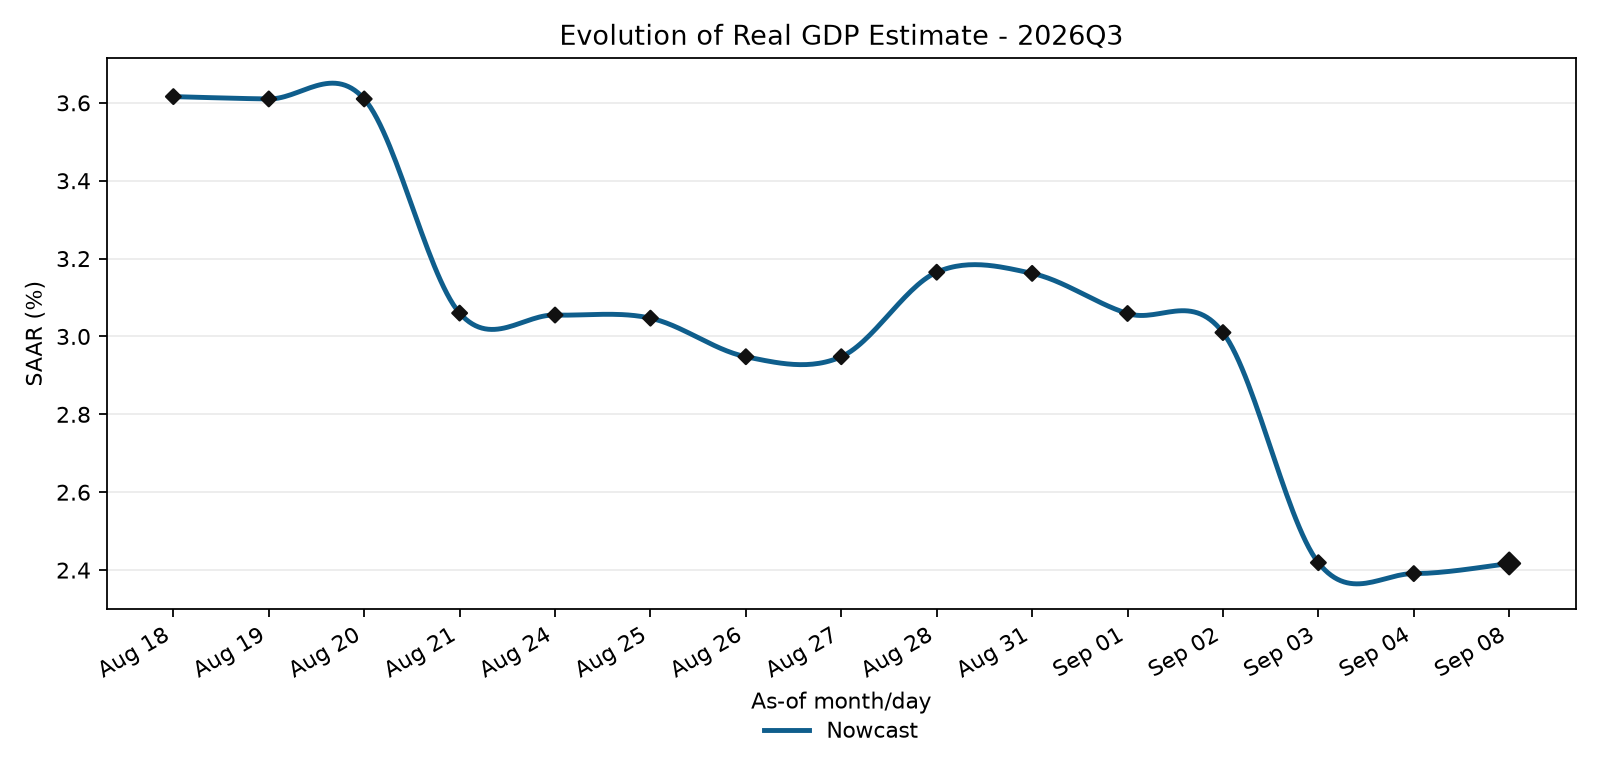
The GDP Dynamics nowcast for third-quarter U.S. real GDP growth edged higher on September 8, rising 0.03 percentage point to 2.42% at a seasonally adjusted annual rate. On a quarter-over-quarter basis, the model is currently tracking growth of about 0.60%.
This is a small update rather than a major change in the Q3 outlook. The previous estimate, published September 4, stood at 2.39%. More importantly, today's increase did not come from a new major consumption, investment, or trade release. The new information entering the model was primarily financial-market data, including the Broad Dollar Index and the 10-year Treasury yield.
The Nowcast Continues to Hover Around 2.4%
The September 8 increase leaves the nowcast near the range it has occupied recently. At 2.42%, the model continues to point toward moderate real GDP growth in the third quarter rather than either a sharp acceleration or an outright contraction.
That distinction matters because a 0.03 percentage-point move is well within the normal evolution of a nowcast as new information arrives. Individual components can move underneath the headline even when the overall GDP estimate barely changes.
Nowcast Path
Net Exports Became Slightly Less of a Drag
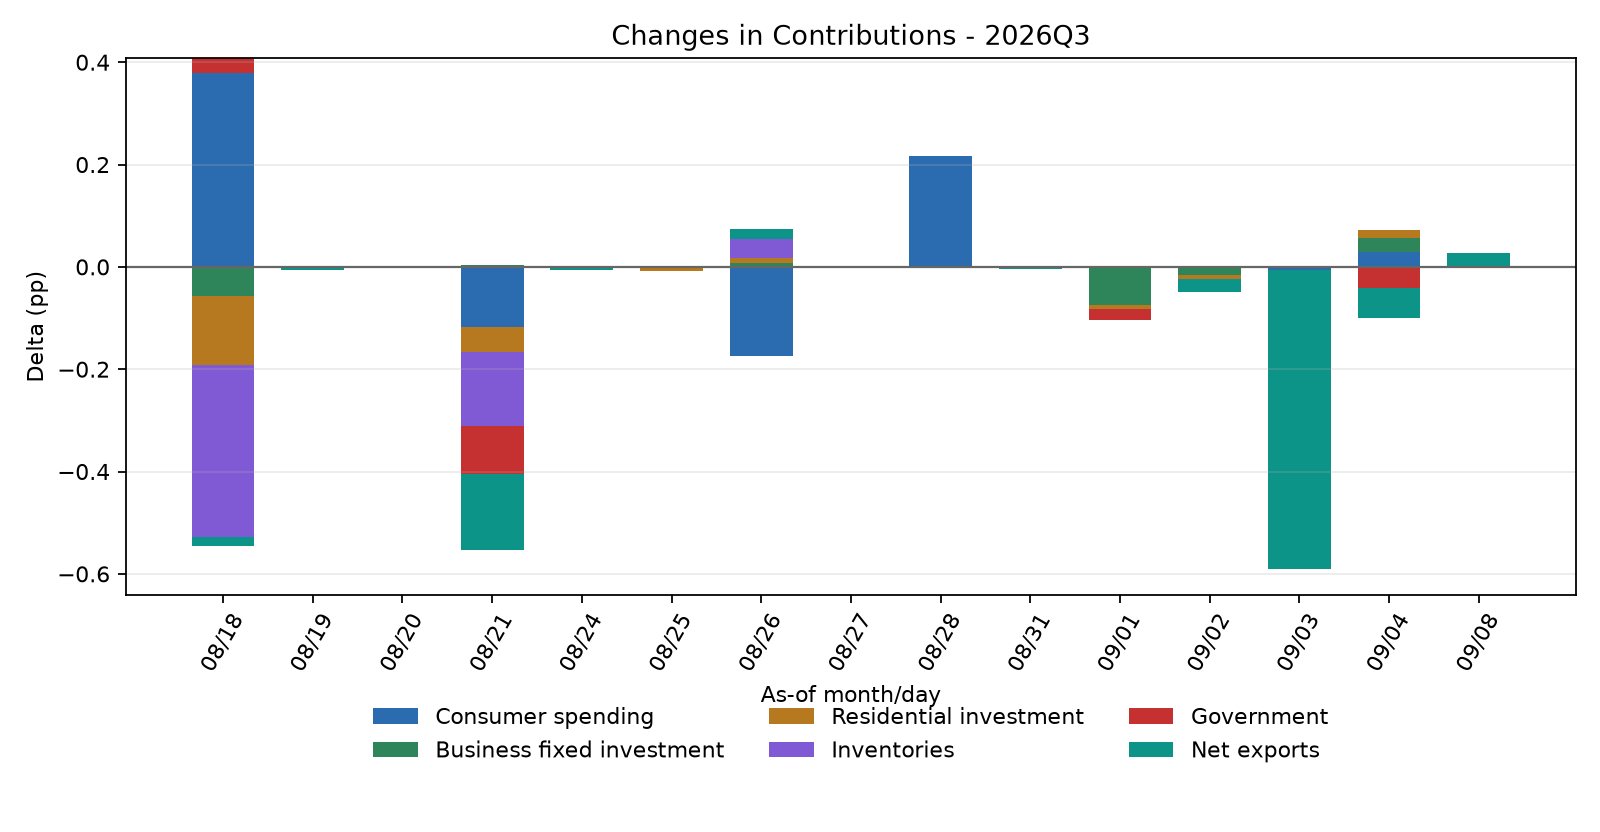
The improvement in today's estimate came through net exports, which added 0.03 percentage point to the nowcast compared with the September 4 update.
That wording is important. Net exports are not currently adding to Q3 growth. They remain a substantial drag on the level of the forecast, subtracting approximately 1.34 percentage points from the current estimate. Today's change simply means that the model now expects that drag to be slightly smaller than it previously did.
The update also should not be interpreted as the result of a new trade report. Instead, the model incorporated new financial information that affects its estimates of the external sector. The Broad Dollar Index is one of the variables used to help capture changes in the trade environment.
Foreign-exchange markets have been moving noticeably. The dollar was roughly flat against its major-currency basket on September 8, but that masked a much larger move against the Japanese yen. The yen has gained nearly 5% since last week amid expectations of tighter Bank of Japan policy, repatriation flows and an unwinding of yen-funded carry trades.
These movements do not tell us directly what third-quarter exports and imports will ultimately be. They do, however, provide new information to a model attempting to estimate trade before the complete quarterly national-accounts data are available.
Higher Treasury Yields Remain Part of the Background
The other available market input in this update was the 10-year Treasury yield, and the bond market has continued to move sharply.
The benchmark 10-year yield was around 4.8% on September 8, near its highest levels since late 2023. Markets are dealing with a combination of stronger nominal growth, persistent inflation concerns, higher oil prices and changing expectations for monetary policy.
That matters for the model beyond today's tiny headline revision. Higher long-term rates affect financing conditions throughout the economy, particularly housing and business investment. Their influence therefore tends to emerge through several parts of the nowcast rather than appearing as a simple one-for-one adjustment to GDP.
Residential investment remains one of the weaker components of the current estimate, subtracting approximately 0.17 percentage point from Q3 growth. Its change in today's update, however, was effectively zero after rounding. There is therefore little reason to characterize housing as responsible for today's movement.
Where Q3 Growth Is Coming From
Looking at contribution levels rather than today's changes gives a very different picture.
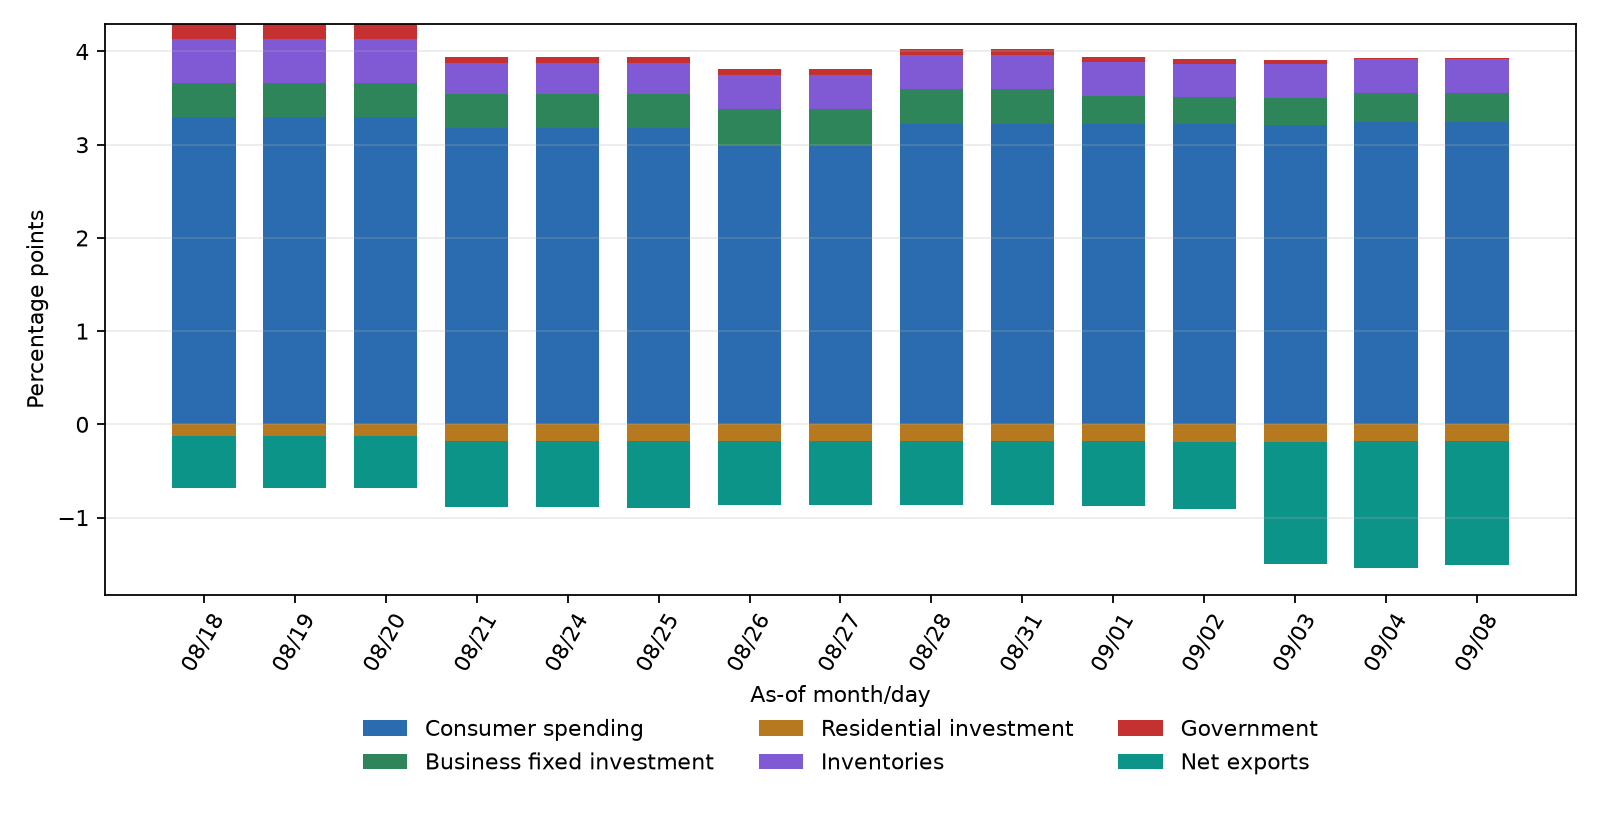
Consumer spending currently contributes approximately 3.24 percentage points to the Q3 estimate. Business fixed investment contributes another 0.32 point, inventories add 0.36 point, and government spending is approximately neutral at +0.01 point.
Those positive contributions are partially offset by residential investment at -0.17 point and, much more significantly, net exports at -1.34 points.
Contribution Levels
Consumer spending therefore remains extremely important to the level of the forecast, but that does not mean it "drove" today's increase. Its large contribution mostly reflects the structural importance of consumption within the U.S. economy and the information already incorporated into the model.
The component that actually changed enough to explain today's headline revision was net exports.
What Actually Changed Since September 4
This is why I prefer looking at both contribution levels and contribution changes when interpreting a nowcast.
The level chart answers one question: What is currently contributing to estimated Q3 growth?
The change chart answers another: What caused the forecast to move today?
For September 8, that second question has a straightforward answer. Net exports improved the estimate by approximately 0.03 percentage point, while the change attributed to residential investment was effectively zero after rounding. The result was the increase in the headline nowcast from 2.39% to 2.42%.
Contribution Changes
The Q3 Picture
At 2.42% SAAR, the GDP Dynamics model continues to show an economy expanding at a moderate pace in the third quarter.
Today's update does not materially change that picture. If anything, its importance is in what it does not show. There was no broad upward revision across the domestic economy. Instead, a modest improvement in the estimated external-sector drag was enough to move the headline forecast three basis points higher.
The composition underneath the headline remains more interesting than the headline change itself. Consumer spending continues to provide a large positive contribution, inventories and business fixed investment remain positive, residential investment remains a modest drag, and net exports continue to remove more than a percentage point from estimated Q3 growth.
The next major economic releases will provide much more information about whether those relationships persist. Until then, 2.42% remains the GDP Dynamics estimate for Q3 real GDP growth.