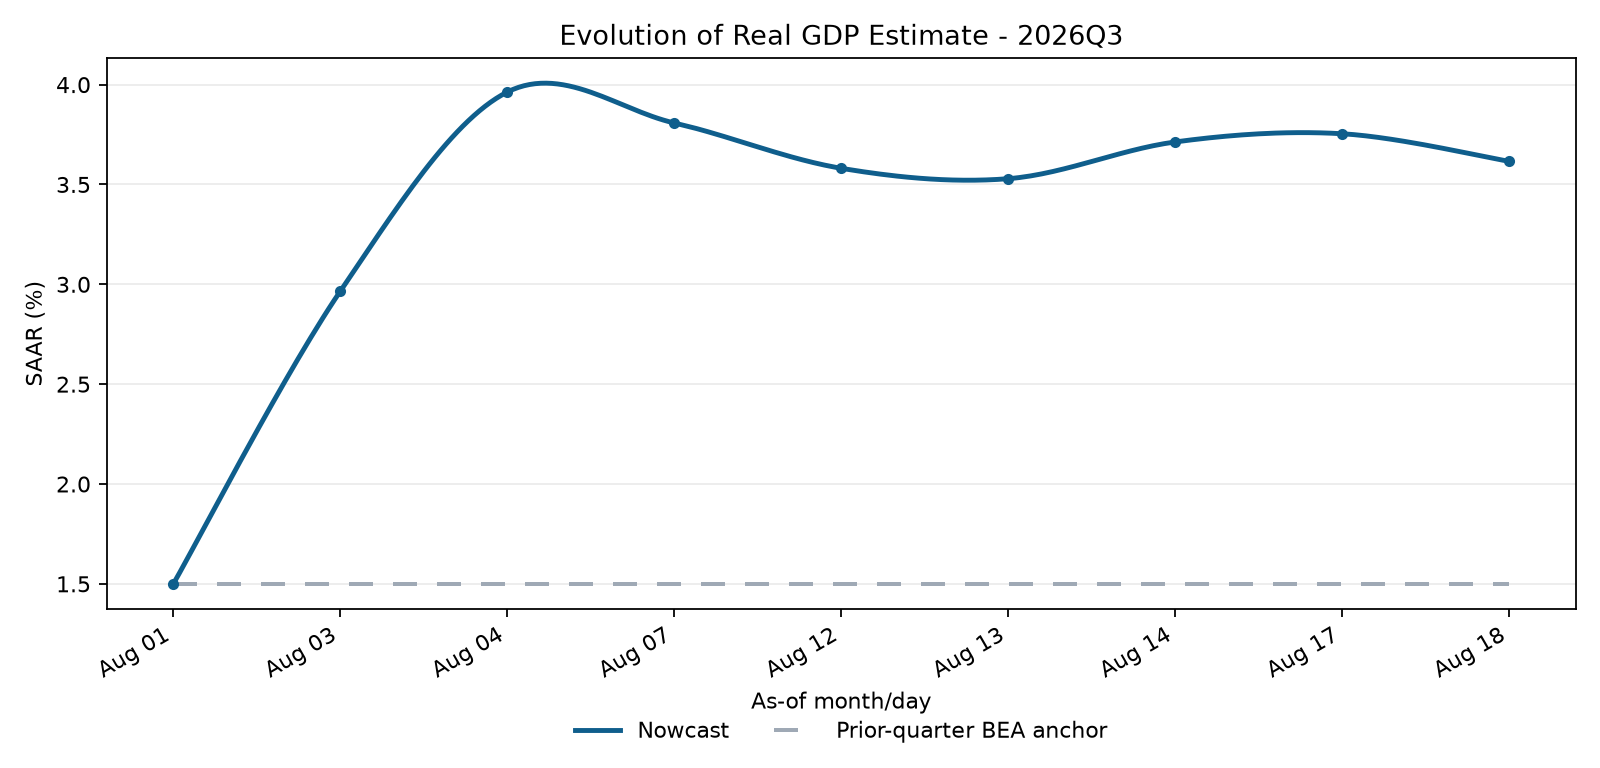
My estimate for third-quarter U.S. real GDP growth slipped again on August 18, falling 0.14 percentage point from 3.76% to 3.62% at a seasonally adjusted annual rate. That works out to roughly 0.90% growth quarter over quarter.
The decline came after a mixed batch of data. Industrial production continued to expand in July, but the housing numbers were considerably weaker. The result was another small step down in the Q3 estimate, even though the model still sees growth running at a fairly healthy pace.
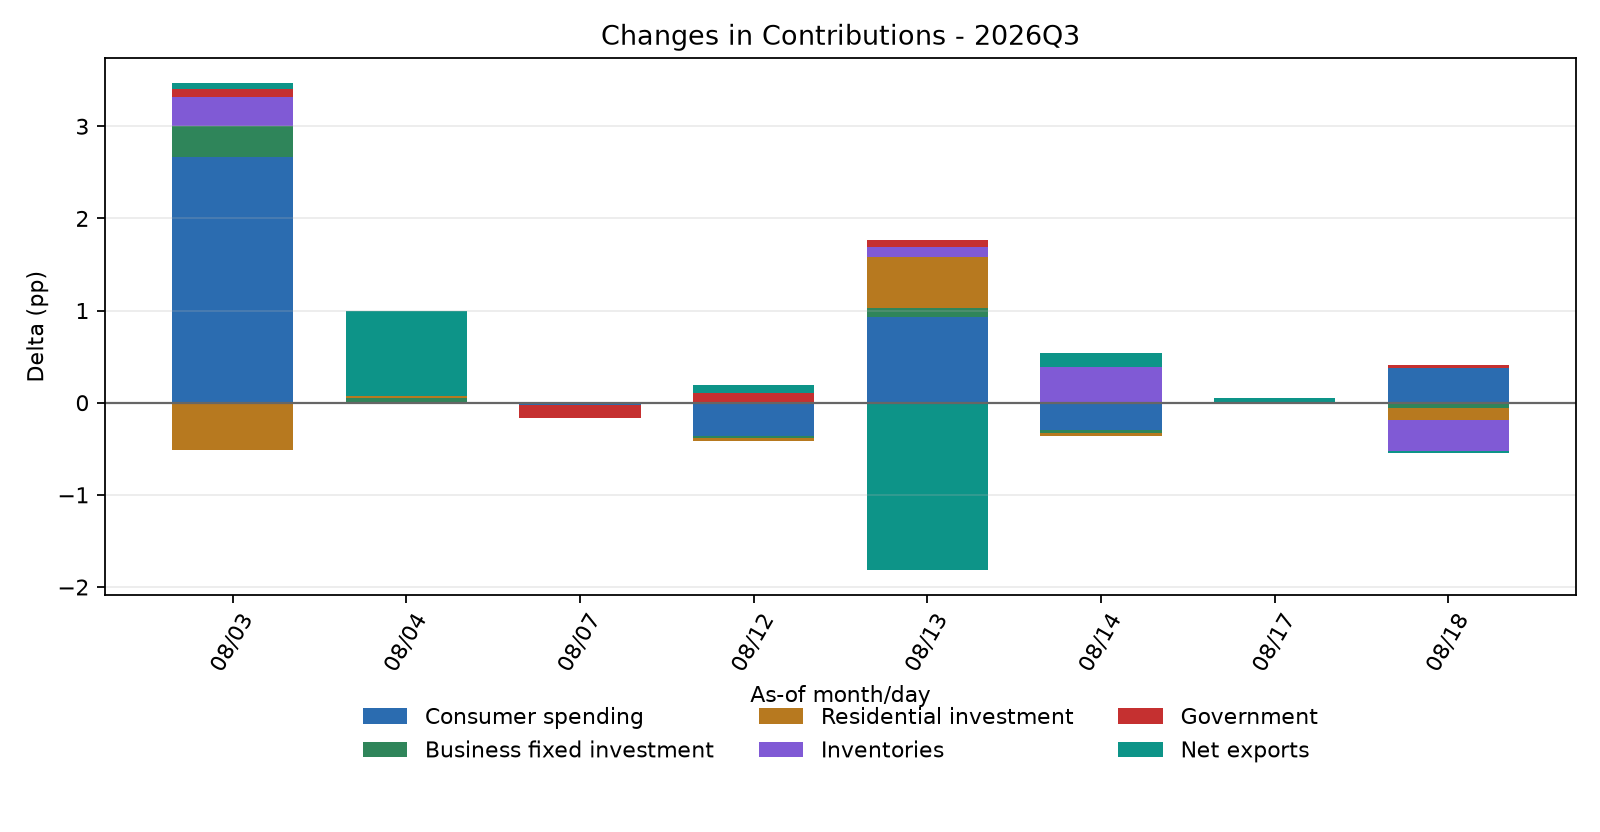
The biggest hit came from inventories, which knocked 0.34 percentage point off the nowcast compared with the previous update. Residential investment was next, subtracting 0.14 point, while business fixed investment took off another 0.06 point. Net exports shaved off 0.02 point. Those declines were partly offset by a surprisingly large 0.38-point increase from consumer spending and another 0.03 point from government.
The housing data give us the clearest explanation for today's drop. Housing starts fell 12.4% in July to an annual rate of 1.239 million units. More importantly for the underlying residential trend, single-family starts dropped 9.9% to just 808,000 units. That was the lowest level in more than three and a half years.
There was one somewhat better signal buried in the report. Total building permits increased 5.0% to a 1.443 million annual rate, while single-family permits rose 2.5%. That suggests the July collapse in actual starts does not necessarily mean construction will continue falling at the same pace. But permits remain relatively weak, and the immediate signal for Q3 residential construction was clearly negative.
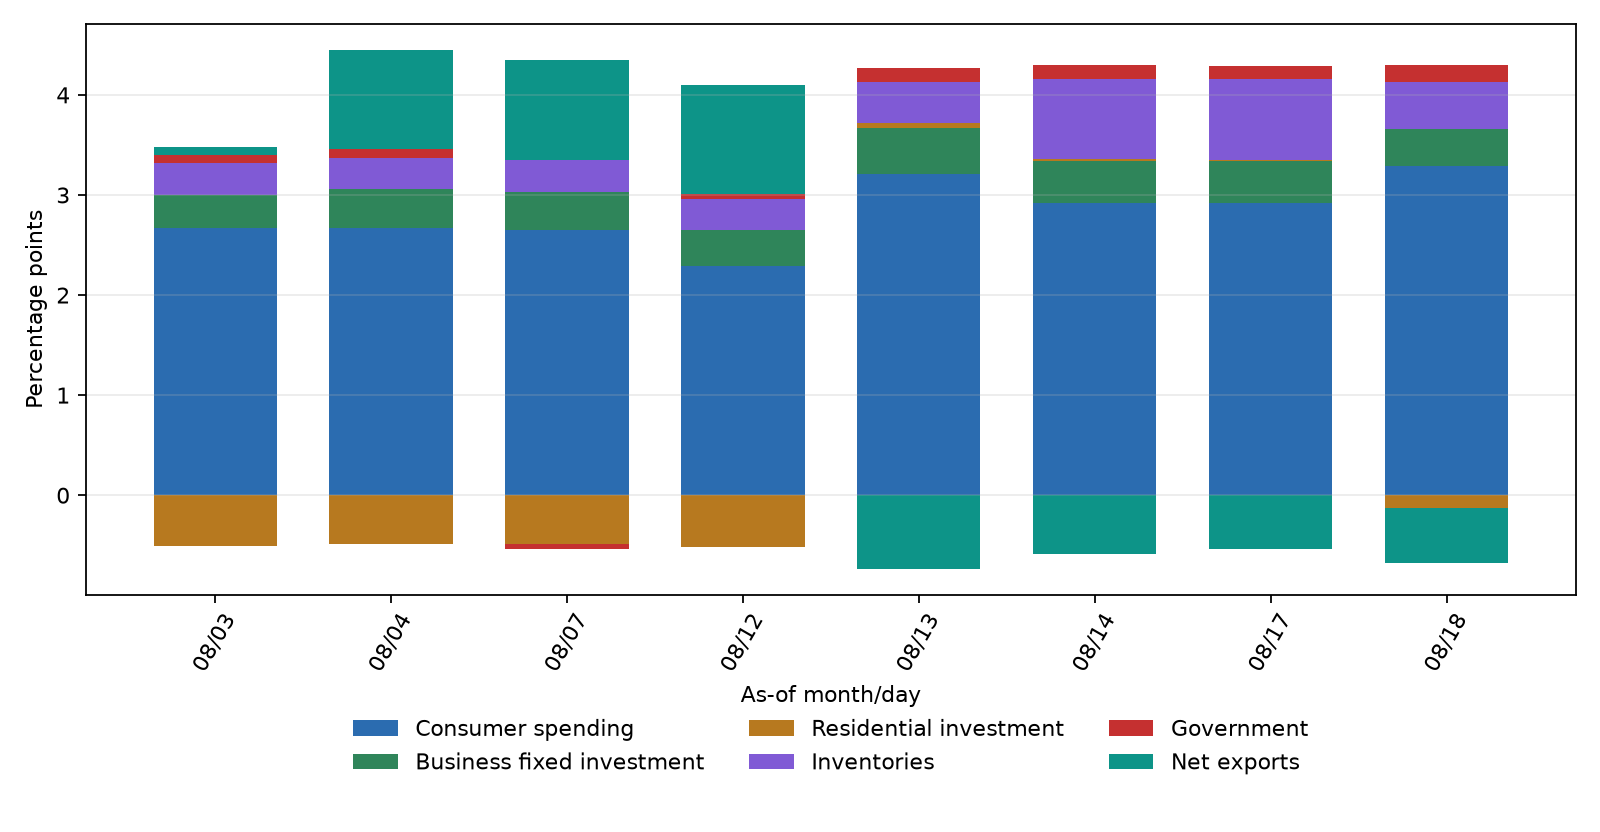
That weakness shows up directly in the model. Residential investment's contribution fell by 0.14 percentage point and now subtracts about 0.13 point from the overall Q3 growth estimate.
Nowcast Path
Industrial production gave a much more mixed picture. Total industrial production increased 0.2% in July after a revised 0.3% increase in June, while manufacturing output also rose 0.2%. Capacity utilization edged up to 76.3%.
Underneath the headline, however, the composition was uneven. Consumer-goods production fell 0.4%, while business-equipment production jumped 0.8%. Construction supplies were also up 0.8%. Manufacturing therefore does not look like it is rolling over, but neither was July strong enough to erase weakness elsewhere in the economy.
The business-equipment number is particularly interesting because my business fixed investment contribution nevertheless declined 0.06 point in today's update. That is a useful reminder that the model is combining several indicators rather than mechanically translating one release into GDP. Business fixed investment still contributes about 0.37 percentage point to the Q3 estimate, so the model continues to expect investment to support growth even after today's downgrade.
Contribution Levels
Consumer spending remains the main engine of the forecast. Its contribution increased 0.38 point in this update and now stands at an unusually large 3.29 percentage points of projected Q3 growth.
That needs to be interpreted cautiously. The latest retail-sales report was actually weak, with nominal retail sales falling 0.6% in July and the GDP-relevant control measure also declining. Some of that weakness appears to reflect unusual timing effects, including Amazon moving Prime Day into June, but it still isn't an obviously strong consumer report.
So I would not read the model's 0.38-point consumer increase as evidence that today's releases suddenly revealed booming household demand. It is better understood as the way the model's current combination of high-frequency indicators, transformations and component estimates changed as the new data entered the system. Upcoming income and PCE data will be especially important for determining whether that strong consumer contribution survives.
Inventories are another major source of uncertainty. They remain a positive contributor to the level of Q3 growth, currently adding about 0.47 percentage point, but that contribution fell 0.34 point in today's update. In other words, the model still expects inventory accumulation to support growth, just considerably less than it did yesterday.
The same distinction matters across the rest of the forecast. Net exports deteriorated by 0.02 point and currently subtract about 0.55 point from growth. Government improved slightly and contributes 0.16 point. Business fixed investment contributes 0.37 point despite today's decline, while residential investment has now moved into negative territory.
Taken together, the composition of the forecast is becoming more interesting than the headline number itself. A 3.62% annualized growth rate would still represent a solid quarter, but the model is increasingly dependent on consumer spending to get there. Housing is moving in the opposite direction, inventories have become less supportive, and the latest industrial numbers are positive without being particularly strong.
Contribution Changes
That also means the 3.62% estimate should not be treated as a settled forecast. We are still relatively early in the Q3 data cycle. The current snapshot contains only nine released items, so there is plenty of room for the estimate to move as the remaining July and August data arrive.
For now, the August 18 update leaves the basic picture intact: Q3 growth still looks solid, but today's housing report exposed another weak spot underneath the headline. If consumer spending holds up, the economy can absorb quite a bit of weakness elsewhere. If that 3.29-point consumer contribution begins to fade as more data arrive, the headline nowcast could come down much more quickly.
You can follow the latest GDP Dynamics nowcast and future updates at GDPDynamics.com.